We are thrilled to announce the launch of two new data resources reflecting information from the First Destination Survey (FDS)!
The FDS Public Data Dashboard and the internal Undergraduate First Destination Outcomes visualization are interactive tools that provide a transparent, data-driven look at the career outcomes of UW–Madison undergraduate students within their first six months post-graduation.
The public dashboard is accessible to anyone and filterable by school/college, majors, and broad geographic locations. This is the first time UW-Madison has had a publicly available dashboard to share with current and prospective students, as well as internal and external stakeholders! The internal visualization is only accessible to authorized UW employees and now includes the ability to break down outcomes by several demographic variables, as well as expanded data elements from the new survey tool (12twenty) we implemented in 2024-25.
Data at a Glance: The Class of 2024-2025
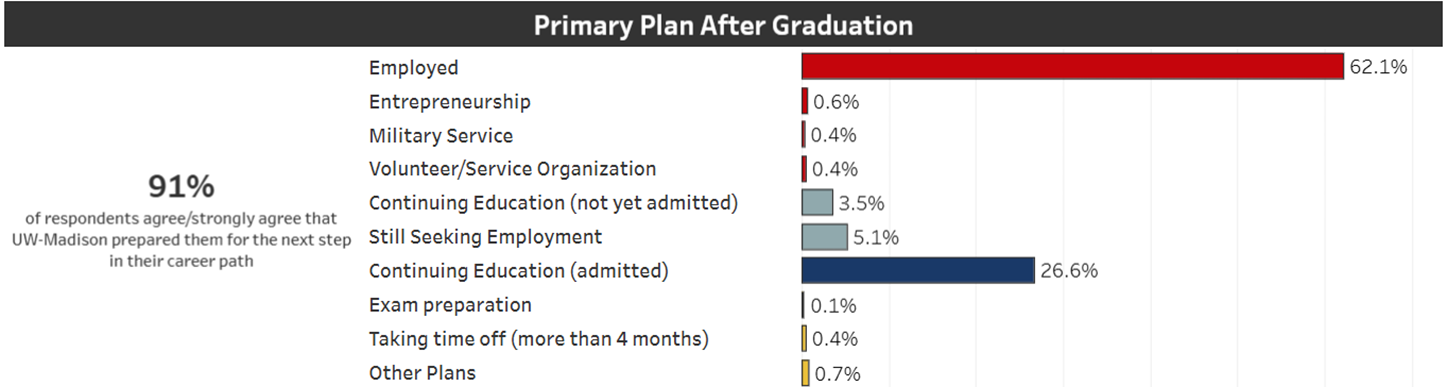
The information in both the public and internal data resources reflects outcomes for bachelor’s degree recipients from Summer 2024, Fall 2024, and Spring 2025. Thanks to a massive cross-campus effort, we have achieved a strong snapshot of our recent alumni, collecting verifiable outcomes for 6,400 students, which reflect 70% of the graduating class. Of those outcomes, over 62% of recent alumni report being employed and 26% admitted to a continuing education program.
A particular point of pride is that 91% of the class of 2024-2025 agrees that UW-Madison prepared them for the next step in their career path, reflecting the collective efforts by so many within the career services community!
Fun Fact on Data Collection for FDS: While student-submitted surveys are our primary source, we supplement this information via the National Student Clearinghouse, LinkedIn, and university enrollment records to ensure our “Knowledge Rate” is as comprehensive as possible.
Why These Resources Matter & How to Use Them
These data resources aren’t just a collection of numbers; they are strategy and storytelling tools. It highlights the diverse paths our students take, from entering the workforce in a variety of industries and roles to pursuing continued education across disciplines.
How you can use the public FDS dashboard:
- Advising Students: We know major doesn’t dictate career, but the public dashboard can provide a starting point for career exploration of industries, job titles, and employers. Many current and prospective students want to know what fellow Badgers with their major ended up doing following graduation and this is a resource they can explore on their own.
- Alumni and Employer Engagement: FDS data can inform conversations with and/or outreach to specific employer and alumni stakeholders. With it being publicly visible, you can encourage external contacts to share with organizational leadership or recruitment colleagues.
- Faculty Partnerships: Highlight public dashboard data to showcase how students may be applying what they learn to their careers and continuing education. Brainstorm potential collaborations between curriculum and career pathways, including career assignments within courses, alumni guest speakers, or industry-based case studies.
Whether you are partnering with employers and alumni, advising a current or prospective Badger, updating leadership, or collaborating with faculty, the public FDS dashboard is an invaluable resource for showcasing the power of a UW–Madison degree.
How to access the internal FDS visualization:
- Before getting started, we HIGHLY encourage you to review our Using Institutional Data website page to learn (or refresh) your understanding of the policies and laws related to how data can be accessed and shared. Restricted data may not be shared without verification that those receiving the data are specifically authorized to view the data.
- The internal Undergraduate First Destination Outcomes visualization provides more granular detail and filtering capabilities of several demographic variables, as well as school/college and major-specific data from the FDS survey. Because of the demographic variables and unredacted numbers, this visualization has a restricted data classification which many career services staff may not have.
- If you don’t currently have access to restricted data, you will need to log-in to Badger Data Access and request the “Enrollment Management – Student Record” Access Group. Not sure if you have access? Try opening the internal Undergraduate First Destination Outcomes visualization when you are on-campus or connected to VPN.
- If you are off-campus, you will need to first connect to the WiscVPN to access non-public data dashboards/reports like the internal Undergraduate First Destination Outcomes visualization.
Moving Forward: How You Can Help
Data collection for the current FDS cycle is already underway, and we need your efforts to keep our Knowledge Rate high. Please continue to promote the survey to graduating seniors! Encouragement from known and trusted sources like advisors and faculty drastically increases survey completion rates!
- FDS Promotion Toolkit: Use our FDS Promotion Toolkit with helpful links, social media graphics, and presentation slides.
- Questions? Reach out to the team at plans@provost.wisc.edu.
A huge thank you to the career services staff and campus partners who utilize 12twenty and promote the survey to make this data possible. We especially would like to recognize Sara Lazenby and Kassie Bentzinger within Data, Academic Planning and Institutional Research (DAPIR) for their continued partnership and work on both of these resources!